|
Analysis Details
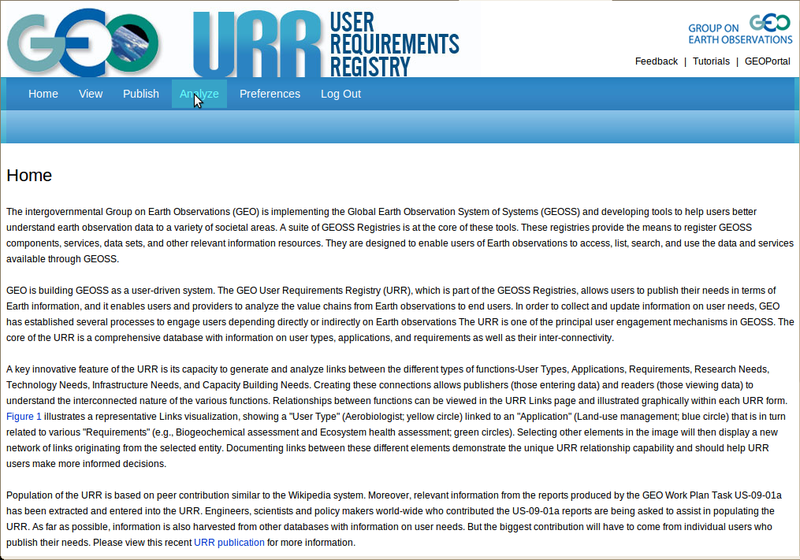
It is anticipated that the Analyze menu will include the capacity to analyze 'Trees,' 'Environments,' 'Networks' and 'Gaps'. For each of these menu items, the analysis domain is expected to be defined by the choices made in the Preference menu and there are expected to be options to further narrow down the domain through additional constraints and choices. The user is expected to have the option to select the link degree to which links are displayed:
- For 'Trees,' the user is expected to have the choice to see the analysis results as an exportable graphic. An option to generate and print a report (export to pdf) also is expected to be available. The option of an interactive, clickable graphic is being investigated.
- For 'Environments,' an interactive graphical tool is expected to be very important and necessary. Users are expected to be able to start with a specific entry and then have the choice to make any of the entries displayed in the environment to the new center of the environment. Moreover, moving the cursor over the symbol of an entry will bring up a menu box with several menu items, including View, Edit and Add to Portfolio with the obvious functions.
- For 'Networks,' the active, multi-dimensional network is expected to be displayed in a graphics potentially larger than the screen size, the interactive options to move over the network and display different section of the total network. There are expected to be options such as: (1) to compute a number of characteristic variables of a network; (2) to change the geometry of the network by changing the selection constraints; and (3) to generate reports and export the graphics.
- For 'Gaps,' it is expected that a range of options is expected to be available such as: identify gaps to match available data sets/services and the requirements relevant for the active domain; determine redundancies in available data sets/services; and analyze internal URR gaps. It should be noted that the first two options require a dialog between URR and the CSR, while the last option would identify missing information in the URR itself. More information about the interactive dialog between URR and CSR is described below.
In all graphical presentations, entries of different tables will be displayed with different symbols/colors. Symbols and colors for a given table will be fixed and consistently used through all graphics (e.g., Applications may be blue rectangles, Requirements red circles, User Types black squares, and so forth).
|


